Playing With Data: Birth Plurality In the US
I’ve been a hobbyist data scientist for a couple years. When I heard that Google BigQuery has some public data sets available to anyone I wanted to dive in and see what I could explore and discover. BigQuery is great for this kind of data tinkering since you don’t have to know any data science tools like R, Octave, Matlab, or SciPy. If you know SQL and have a Google account you’re good to go.
The Data Set
One of the public data sets is the natality data set. This data set lists all the births in the 50 states and DC between 1969 and 2008. The set comes from the CDC which collates the data from the different vital statics offices throughout the US.
The data set contains columns for the data you’d expect like:
- year
- month
- day
- state
- weight (in pounds)
It also includes information about the parents that would be useful in studying health trends in the US and such as:
- mother’s age
- father’s age
- whether the mother used alcohol or cigarettes during the pregnancy
Finally it includes some information about the baby:
- gestation (in weeks)
- apgar scores (1 min and 5 min)
- gender
- plurality (whether the child has a twin or triplet, etc)
The Question
Looking at the data I had a bunch of random questions like “What percentage of babies born in Seattle in 2000 had parents born elsewhere?” And “how many babies are born away from the state where their mother lives?”
The one question that stuck with me the most though was “Are multiple births more common now than in the past?”
I hear this a lot in the news and from friends who work in the health industry. There seems to be cultural acceptance of the fact that fertility drugs have increased multiple births in recent years. Since this data set spans so many years it seemed like I could finally back this common assumption up with data.
The Query
The first query I wrote was just to figure out what the highest plurality recorded was.
SELECT
  count(*) as total,
  plurality
FROM
  [publicdata:samples.natality]
GROUP BY
  plurality;
Which yields this result:
| Total | Plurality |
|---|---|
| 3669003 | null |
| 130701468 | 1 |
| 3316642 | 2 |
| 130214 | 3 |
| 8132 | 4 |
| 1304 | 5 |
A surprising number of the records have no plurality. I wondered if that data hadn’t be collected in some states or some years so I ran this query.
SELECT
  count(*) as total,
  year
FROM
  [publicdata:samples.natality]
WHERE
   plurality IS NULL
GROUP BY
  year;
| Total | Plurality |
|---|---|
| 1800103 | 1969 |
| 1868900 | 1970 |
This accounts for all the rows with missing plurality data so it appears that plurality info wasn’t collected until 1971. I can work with that and so I’ll just ignore records without plurality data going forward.
I didn’t exactly know how to extract the records I wanted so I just looked at the plurality data for one year.
SELECT
  count(*) as total,
  plurality
FROM
  [publicdata:samples.natality]
WHERE
  plurality IS NOT NULL AND
  year = 1975
GROUP BY
  plurality;
| total | plurality |
|---|---|
| 2189415 | 1 |
| 42249 | 2 |
| 691 | 3 |
| 31 | 4 |
| 20 | 5 |
Finally, I used an old SQL trick to get the counts for each year, grouped by plurality, in one row. Doing a group by of both year and plurality also works but it gives multiple rows for each year which is harder for programs like Google Sheets and Numbers to graph.
SELECT
  year,
  count(*),
  sum(case when plurality = 1 then 1 else 0 end) as singleton,
  sum(case when plurality = 2 then 1 else 0 end) as twins,
  sum(case when plurality = 3 then 1 else 0 end) as triplets,
  sum(case when plurality = 4 then 1 else 0 end) as quads,
  sum(case when plurality = 5 then 1 else 0 end) as quints
FROM
  [publicdata:samples.natality]
WHERE
  plurality IS NOT NULL
GROUP BY
  year;
The Results
Here’s a graph showing the raw number of singleton, twin, triplet, etc births as recorded in the data set. I had to use a log scale so that you can actually see anything but the singletons.
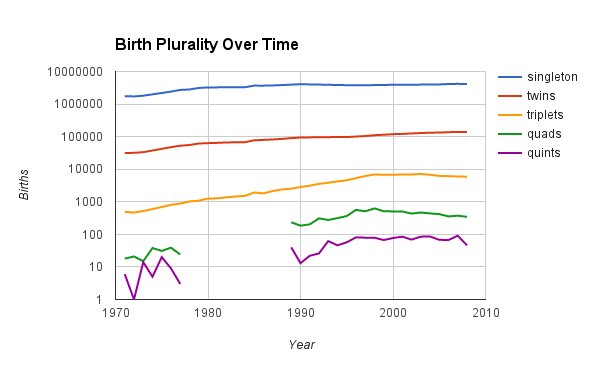
The slope for all the multiple birth lines seems to be steeper than that of the singleton birth line. Twins and triplets especially have noticeably increased. I find it interesting that since about 2000 the rate of higher order multiples (triplets or more) has actually decreased a bit.
I didn’t do any sort of statistical significance testing on the data so I can’t reach any actual conclusions but playing with the data set was fun and I got a better feel for BigQuery. The data from the summary query above is here as a csv if you want to play with it. You can also try it yourself from the BigQuery Homepage.
The code from this post is available on github and is licensed Apache v2.