Stackdriver Advanced Filters
Unless you have a full-time operations role you probably only look at your logging and monitoring tools in two situations: once when you set them up and again when something goes wrong. I know that’s how I usually do things. The problem with that approach is that you only get a chance to learn how to use your tools when you are under the pressure of an outage. A couple of the folks I respect a great deal advise to spend 5 to 10 minutes focused on learning and improving your tools every day. This post should help you learn some of the power user features of Stackdriver Logging. I encourage you to try some of the things in the post so that when you are working to resolve an outage, you already know the tools well.
Advanced Filtering
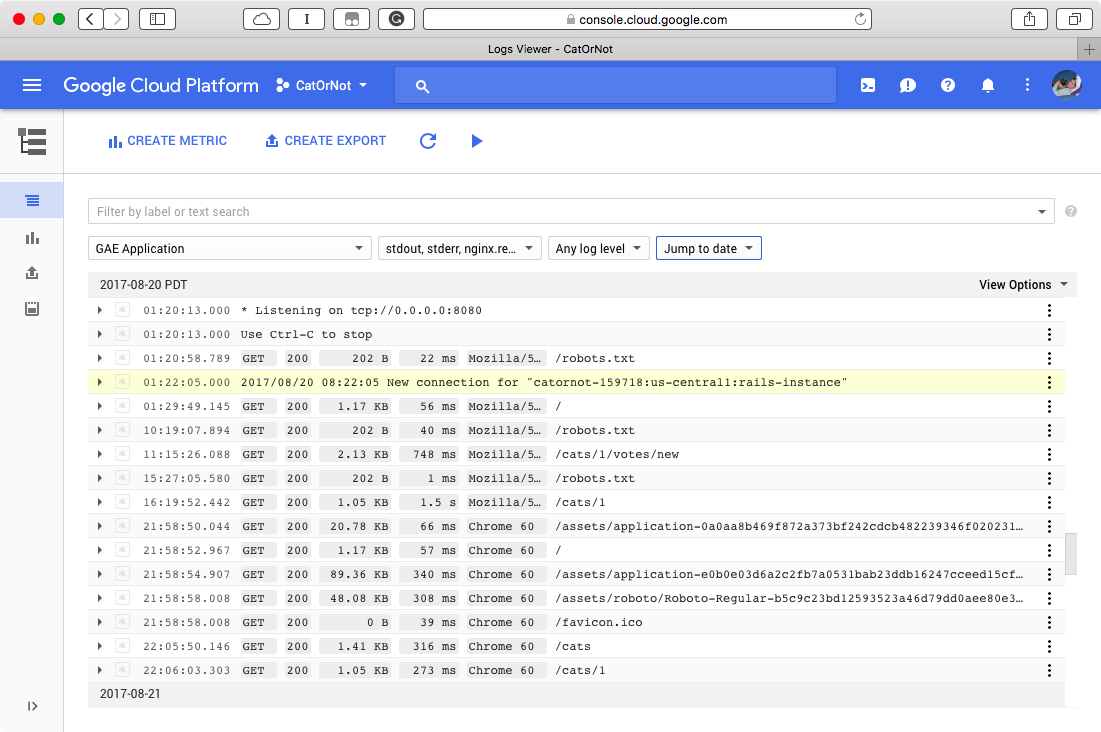
Most people figure out that you can filter your logging results by typing into the box at the top of the logging page. Fewer people realize that by clicking the triangle at the right edge of the box, you can switch to advanced filtering mode. You can use a special syntax to specify the exact logs you want to see. For example, to limit the view to just log messages from GAE you can do this:
resource.type="gae_app"To add more clauses to your filter, you can add more lines. This filter which shows logs from a particular GAE version.
resource.type="gae_app"
resource.labels.version_id="20170523t155550"
You can also use operators like AND, OR, NOT, >, <, etc. Here’s a filter that shows only ERROR and CRITICAL messages.
severity=("ERROR" OR "CRITICAL")Severity is mapped to numeric values so you can also use mathematical comparisons on it like this:
resource.type = gae_app AND
severity >= ERROR
I have trouble keeping track of the field names and possible values. Luckily the user interface will auto-complete what it can, including field names and possible values for fields like severity.
Filter Based on Existing Logs
If you are having problems figuring out what your filter needs to be there’s an easier way to find the correct values. Simply look through your logs until you find the type of message you want to focus on. Then click on a field and click “Show Matching Entries.” This will populate the filter with the correct values.
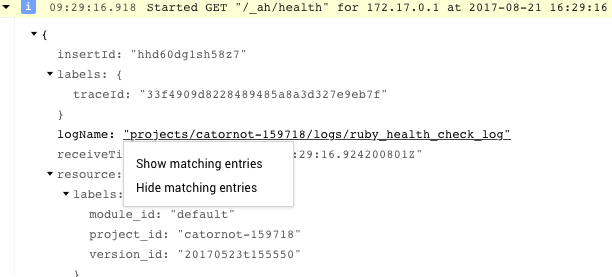
You can also use “Hide Matching Entries” to remove messages that are distracting you from the problem you are trying to fix.
Saving and Sharing
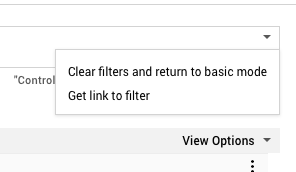
Once you’ve taken the time to figure out the correct filters, you’ll probably want to save them or share them with others on your team. If you click the triangle in the filter box, you can get a link to this particular filter that you can share with teammates or save in documentation or your favorites bar.
This post makes advanced filters seem simple. But like many things in computing you don’t see the power of the feature until you combine the building blocks in unique ways. Having a stash of saved filters for your frequent debug and analysis tasks is much better than having a set of shell scripts to extract the relevant data. Only you know the brittle points of your system and the most useful ways to look at the data when everything seems broken.
If you’d prefer to see a video of advanced filters, here’s a cloud minute covering the very basics of this feature.